Friday, June 21st is #ShowYourStripes day, part of an international campaign to increase attention to the tangible realities of climate change.
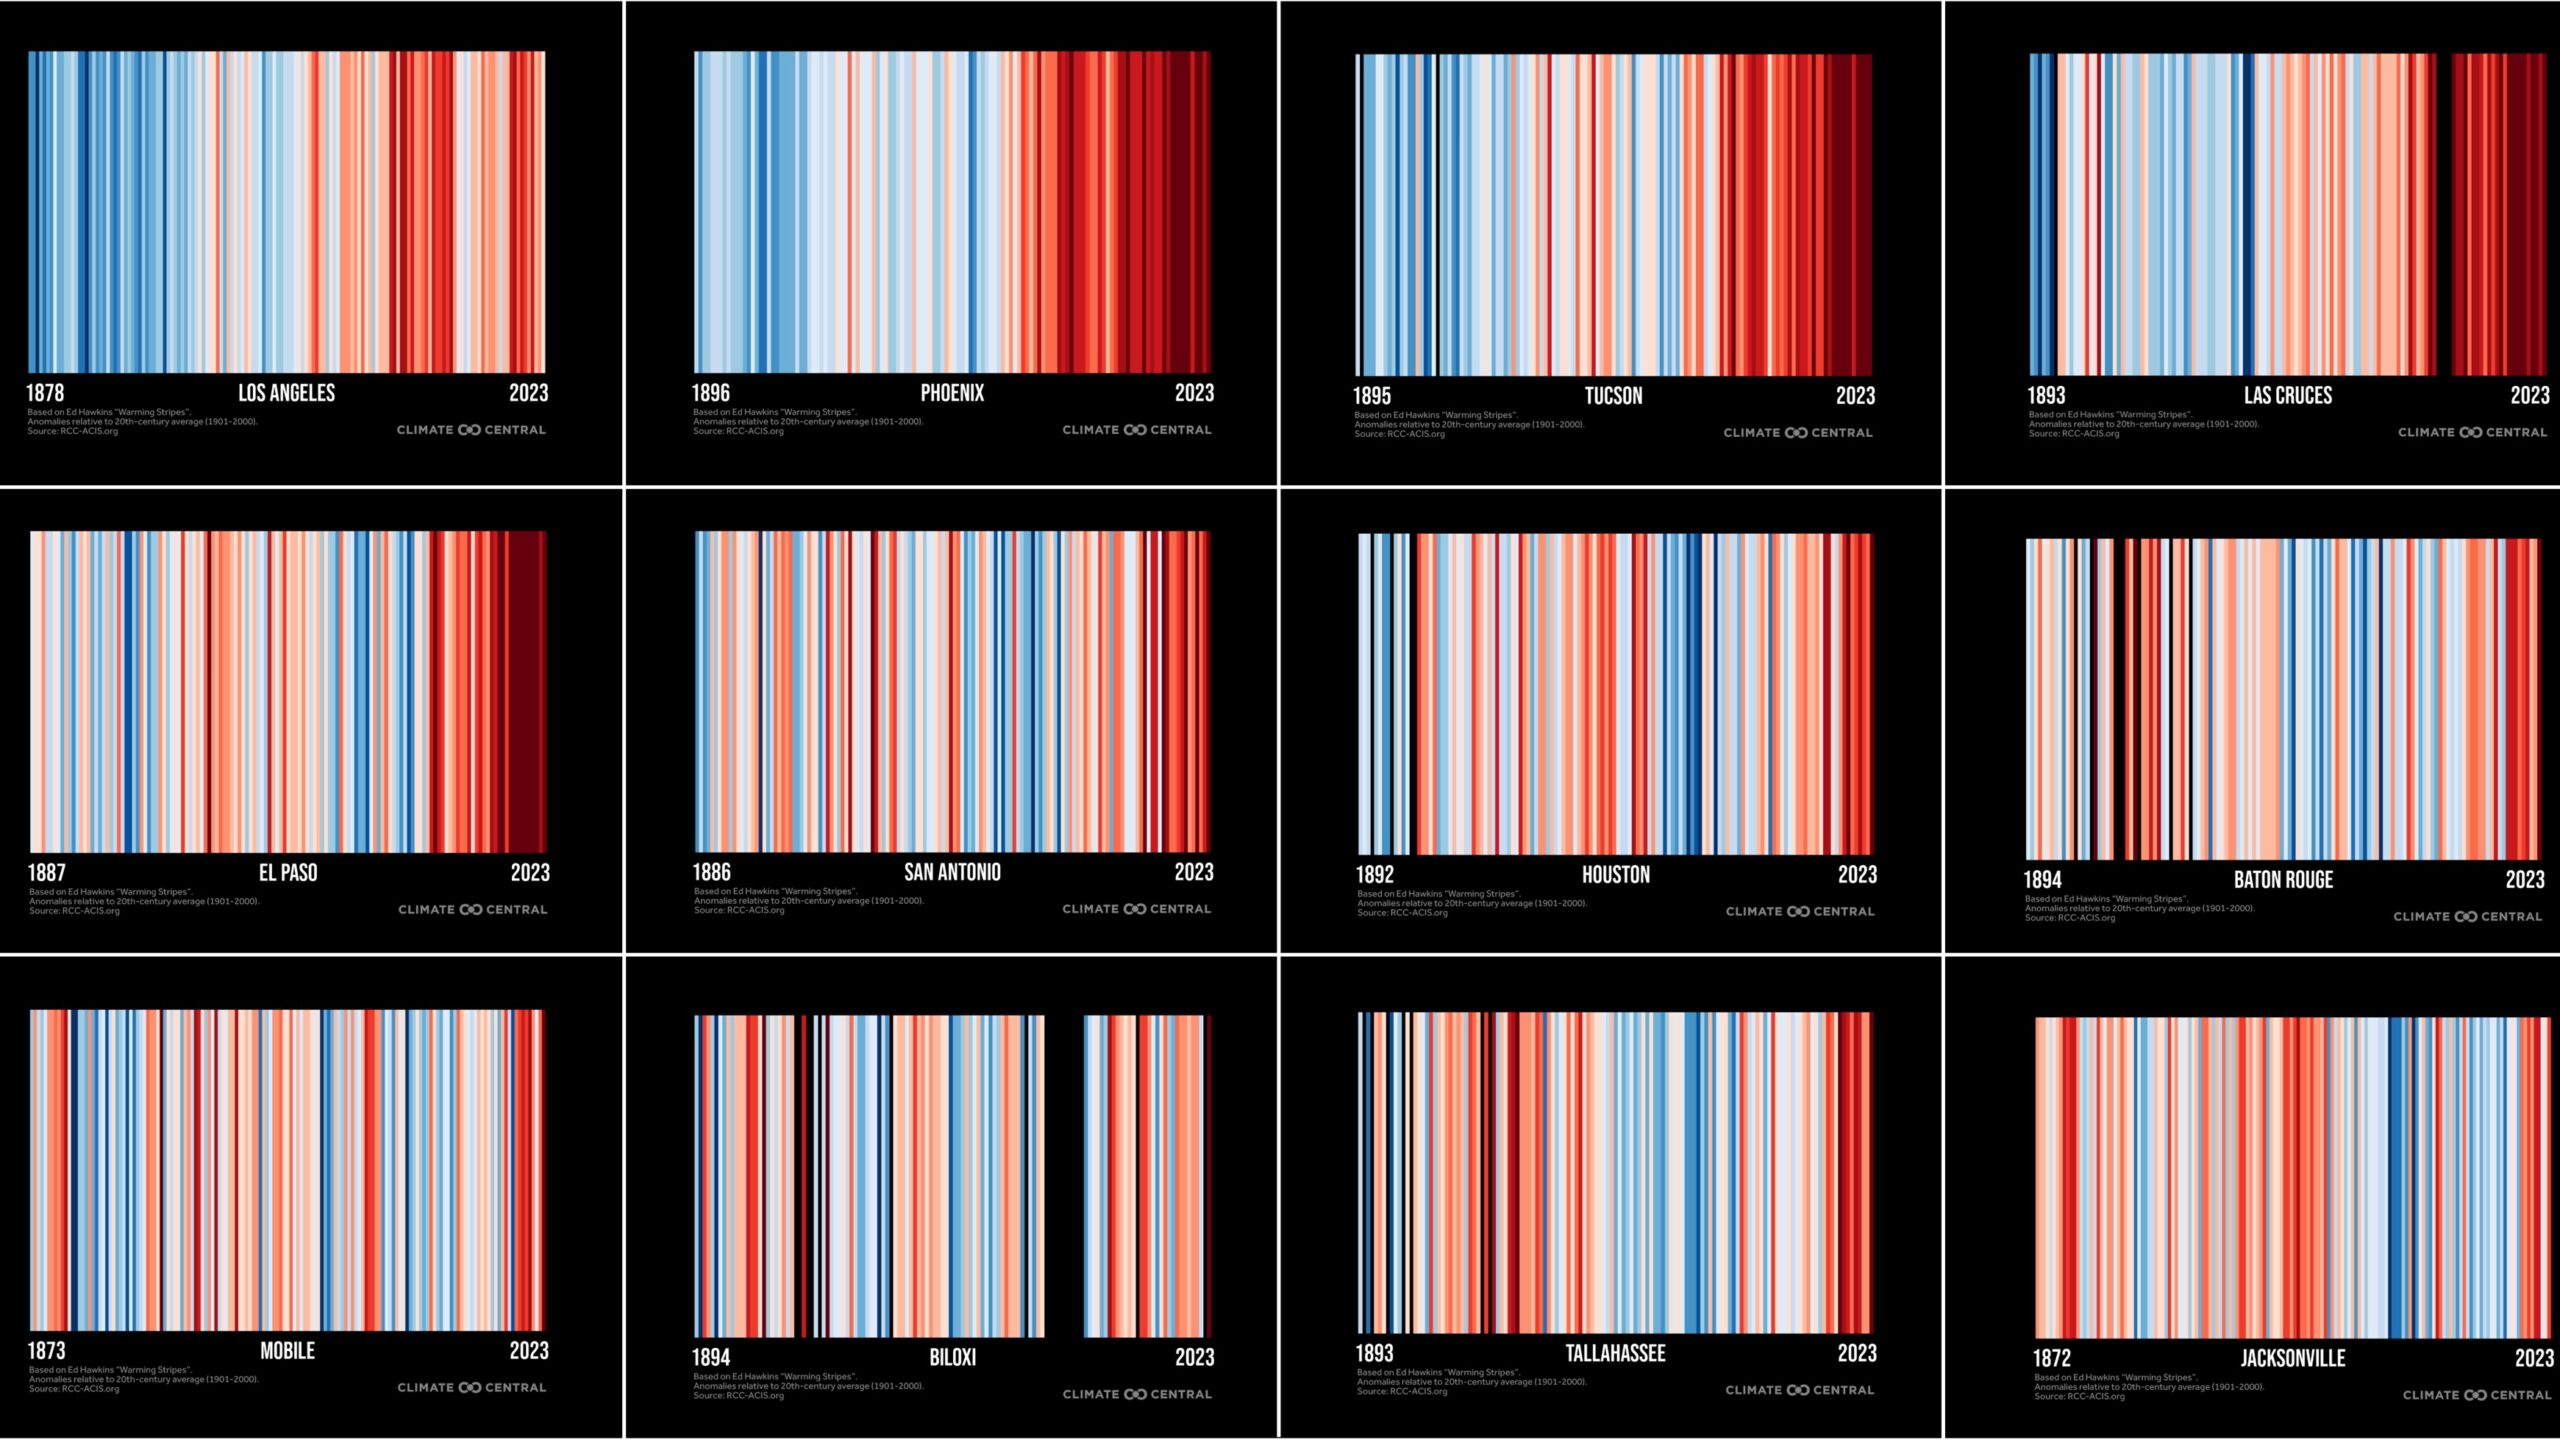
These downloadable “warming stripes” graphics were produced by and are available from our friends at ClimateCentral.org for each of 195 different U.S. cities and 49 states—as well as for the entire U.S. and the globe.
Red stripes represent years when a given location’s average temperature was hotter than its 1971-2000 average, and blue stripes represent cooler years. The palest colored years are those that were closest to that longer-term average.
The barcode-like look of the climate stripes graphics was designed by Professor Ed Hawkins, a climate scientist at the University of Reading. This simple, modern visual tool clearly illustrates the abrupt and distinctive shift to concentrations of deepening red in recent years—particularly so for many Ten Across cities and states.
While the entire Ten Across region with its southern latitudes experiences extreme and prolonged heat more than any other part of the country, Phoenix and El Paso stand out with particularly drastic temperature anomalies in the past year alone—climbing well beyond what even these desert cities are accustomed to cope with.
Climate Central summarizes temperature conditions up to today:
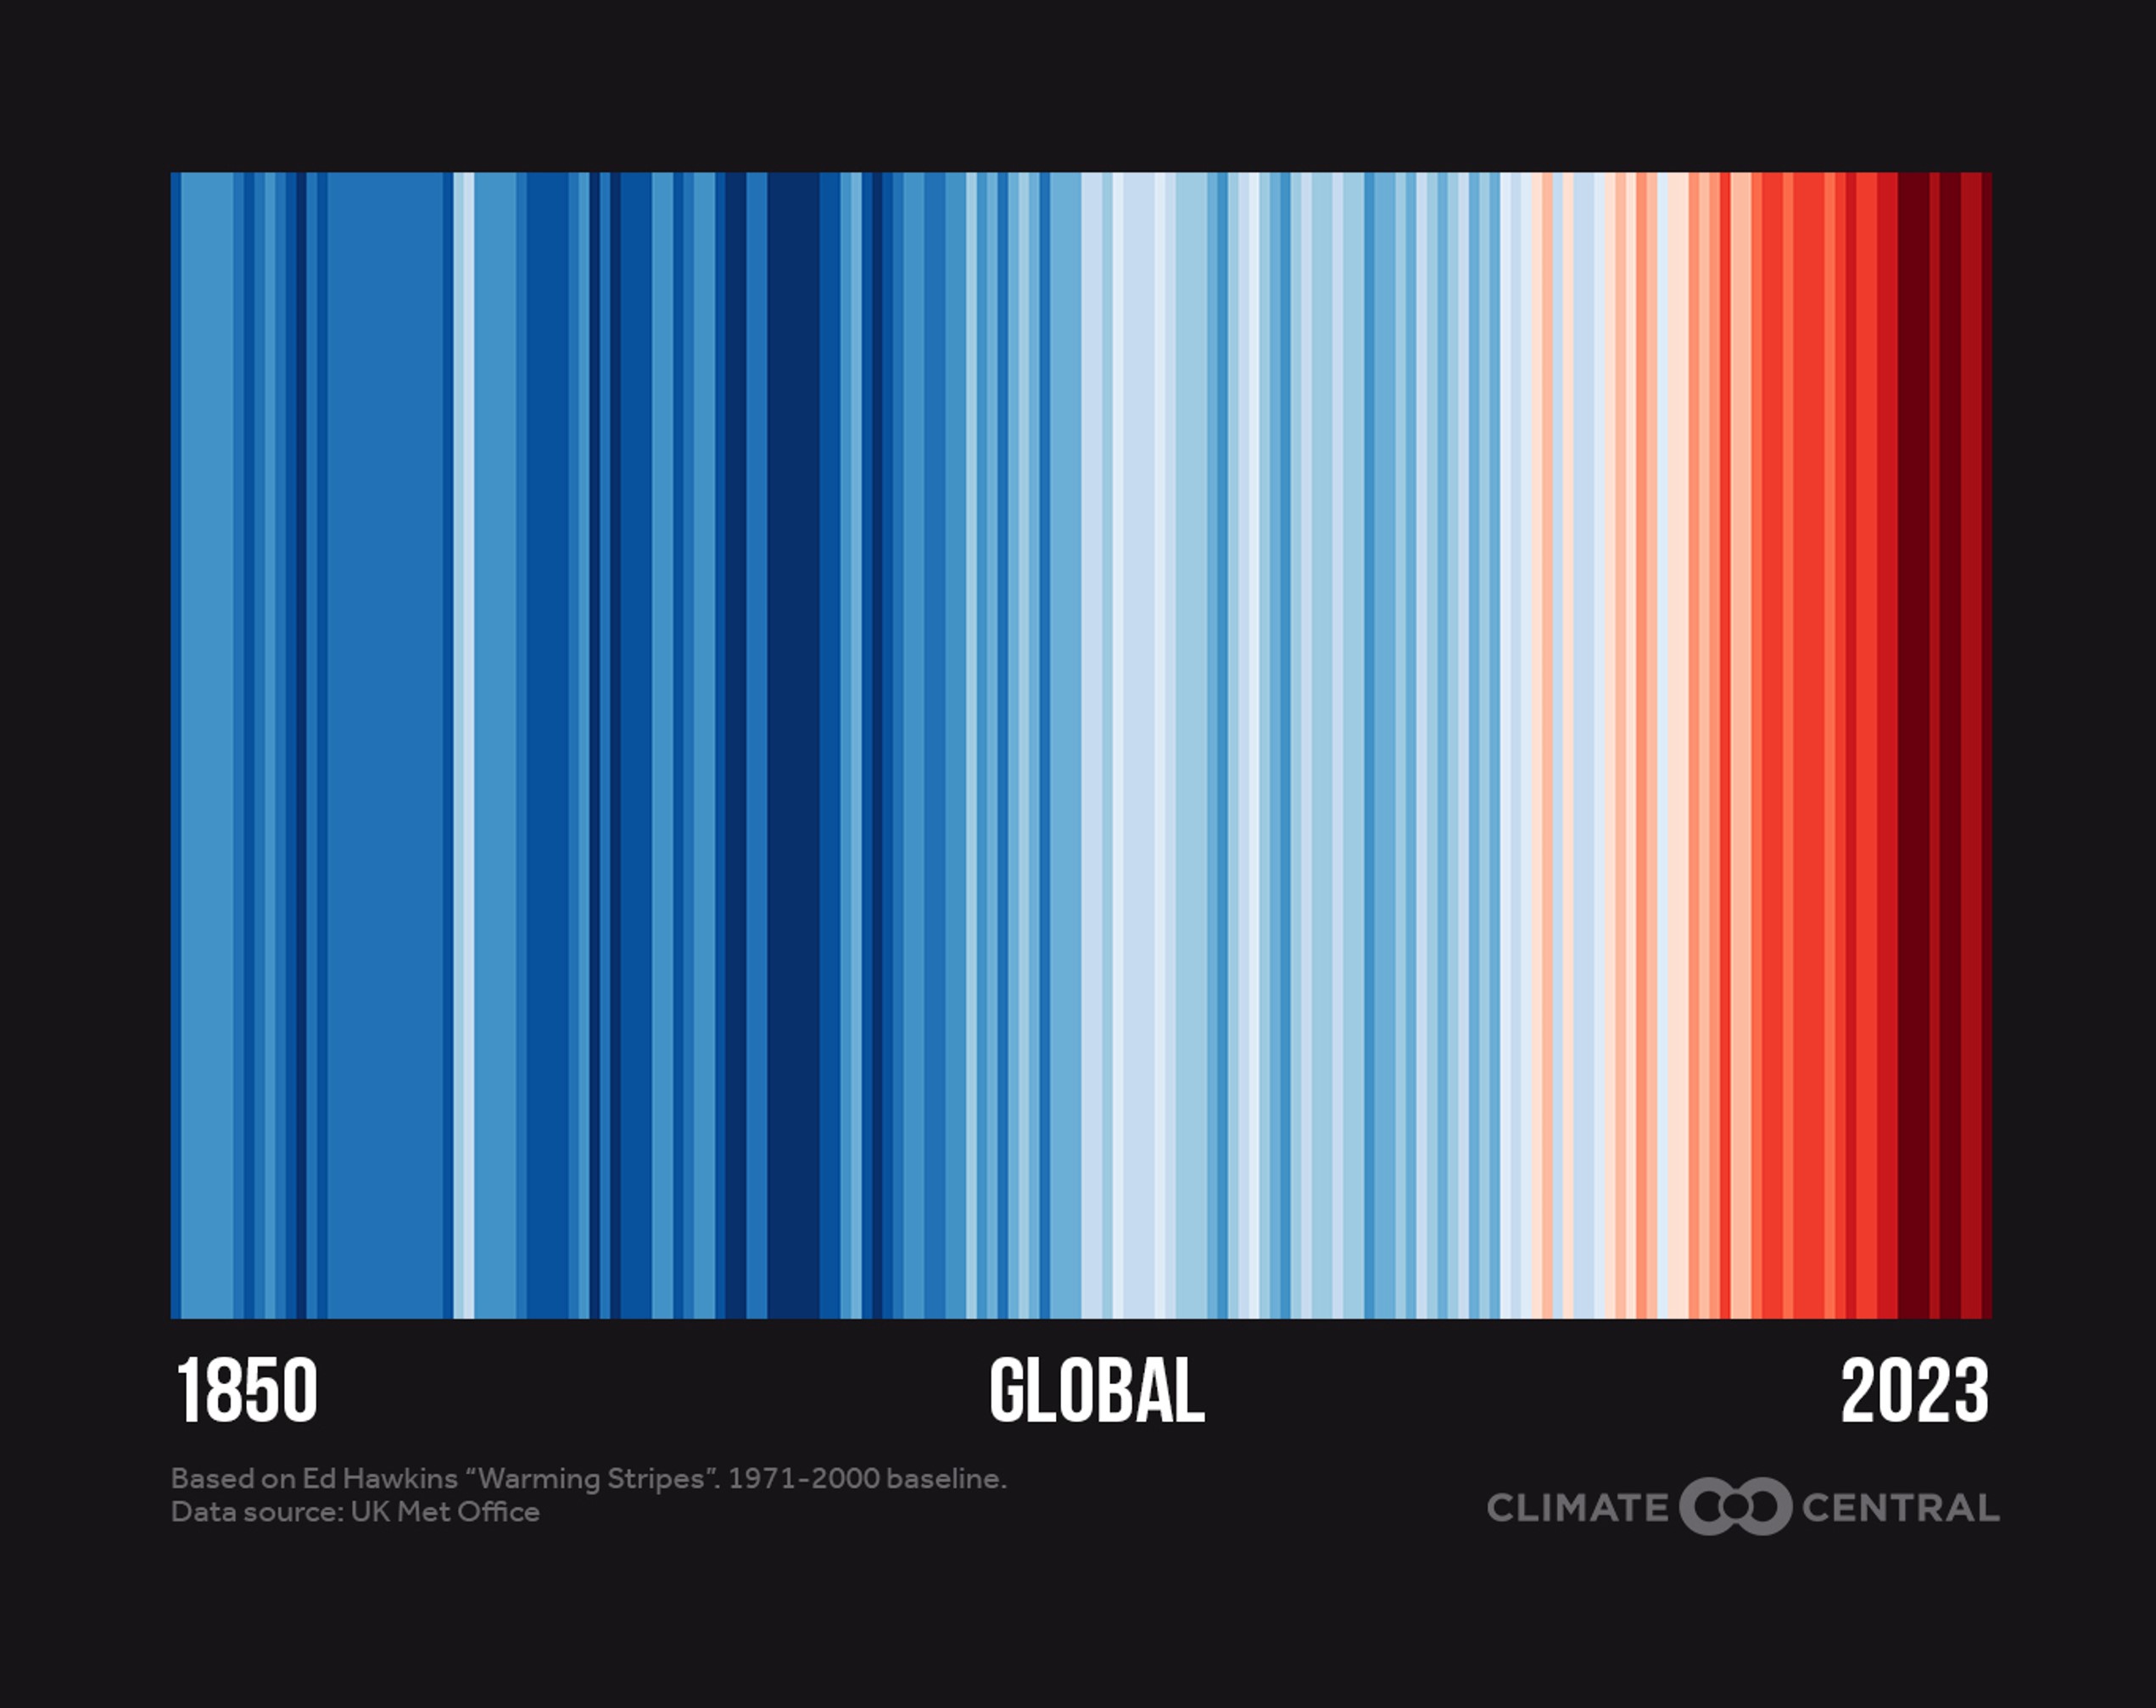
“Global temperatures shattered records in 2023, ranking highest in the 144-year record at 1.4°C (2.5°F) above early industrial (1881-1910) temperatures. Last year broke records by such a wide margin that it’s forcing an expansion of the warming stripes color scale earlier than expected. This record heat streak has continued into 2024 with 12 consecutive months (June 2023 to May 2024) of record-breaking global temperatures — pushing the planet dangerously close to the internationally-agreed goal of limiting warming to a long-term average of 1.5°C (2.7°F) above pre-industrial levels.
This record heat streak has continued into 2024 with 12 consecutive months (June 2023 to May 2024) of record-breaking global temperatures — pushing the planet dangerously close to the internationally-agreed goal of limiting warming to a long-term average of 1.5°C (2.7°F) above pre-industrial levels.
This underscores the urgent need to turn climate conversations — sparked by warming stripes — into faster climate action.”
Ways you can participate and #ShowYourStripes:
- Visit Climate Central’s Show Up for Stripes Day page for more free graphics, examples of warming stripes in action, and to locate landmarks that will light up for #ShowYourStripes day.
- Update your social accounts with warming stripes as Zoom backgrounds and filters for Twitter, Facebook, and LinkedIn.
- Share your warming stripes on social media, TV broadcasts, and in local climate reporting to communicate about warming in your city, state, or across the U.S.
- Explore Climate Central’s resource library for hundreds of graphics and reporting resources that explain the local effects of global climate change — from local impacts (such as warming summers, more frequent fire weather, and heavier downpours) to local solutions (such as growth in solar and wind energy, ways to cut carbon pollution in each state, and the cooling power of trees in your city).